
If you’ve spent any time looking for a JavaScript charting library, you already know the frustration. Most of them are fine for basic bar charts and pie charts, but the moment you throw serious data at them large datasets, real-time streams, multiple charts running at once things start to fall apart. LightningChart JS is built specifically for situations where other libraries tap out, and the difference becomes obvious the moment you start working with it seriously.
LightningChart JS is a GPU-accelerated, WebGL-based JavaScript charting library designed for high-performance data visualization. Instead of relying on the CPU to handle rendering like most charting libraries do, it offloads the heavy lifting to the device’s graphics processor. The result is noticeably faster load times, smoother interactions, and the ability to handle data volumes that would bring other tools to a complete halt. For developers tired of performance workarounds, that’s a genuine relief.
The numbers speak for themselves. The library can render over 500 million data points on a static line chart, and in real-time streaming scenarios, it handles 400 channels at 1,000 Hz, that’s 24 million data points per frame at 60 frames per second. That kind of performance isn’t just impressive on paper. It matters in practice when you’re building applications for industries like medical monitoring, engineering, finance, or IoT, where the data never stops and accuracy is non-negotiable.

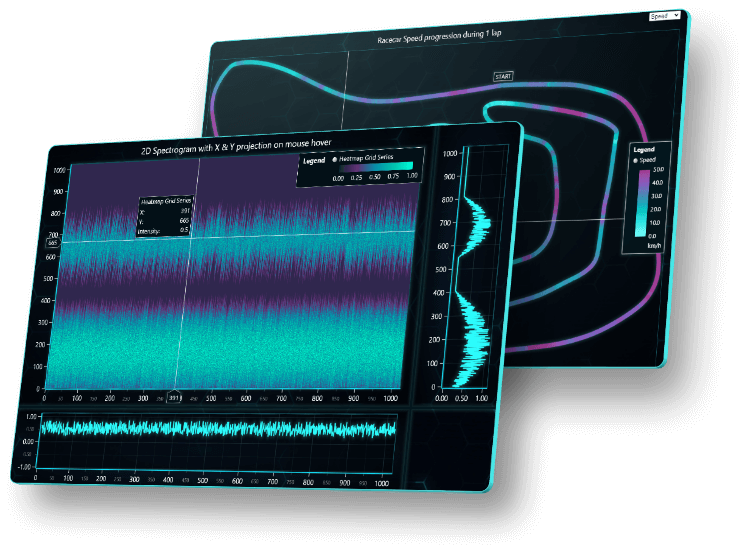
Chart variety is another strong point. LightningChart JS offers more than 100 chart types, including XY charts, heatmaps, 3D surface charts, point clouds, bar charts, statistics charts, gauge charts, and more. There’s also a DataGrid component for displaying real-time tables alongside charts, and a dashboard layout that can handle over 100 charts simultaneously without any performance drop. Whatever your use case, there’s almost certainly a chart type here that fits it.
The interactivity built into the library is worth mentioning too. Zooming, panning, touchscreen support, moving data cursors all of these work smoothly even with massive datasets loaded. The UI is fully customizable, so you’re not locked into a default look that clashes with your application’s design. Themes, colors, axes, legends everything can be adjusted to suit your needs without writing excessive extra code.
Getting started is straightforward. The library is available via NPM, comes with over 10 framework templates for popular setups like React, Angular, and Vue, and includes an interactive examples gallery where you can browse and edit chart code directly in the browser. The documentation is thorough and developer-friendly, so you’re never left guessing your way through the setup process.
Licensing requires a key, with a free 30-day trial available to get a proper feel for the library before committing. Paid tiers include Publisher, Application Developer, SaaS, and Enterprise options depending on the scale and nature of your project. For developers who need a charting library that can genuinely keep up with demanding, data-heavy applications, LightningChart JS is one of the few options that delivers on its promises without compromise. It’s fast, flexible, and built for real work.